GraphAbs
Create: Manhattan plot anatomy
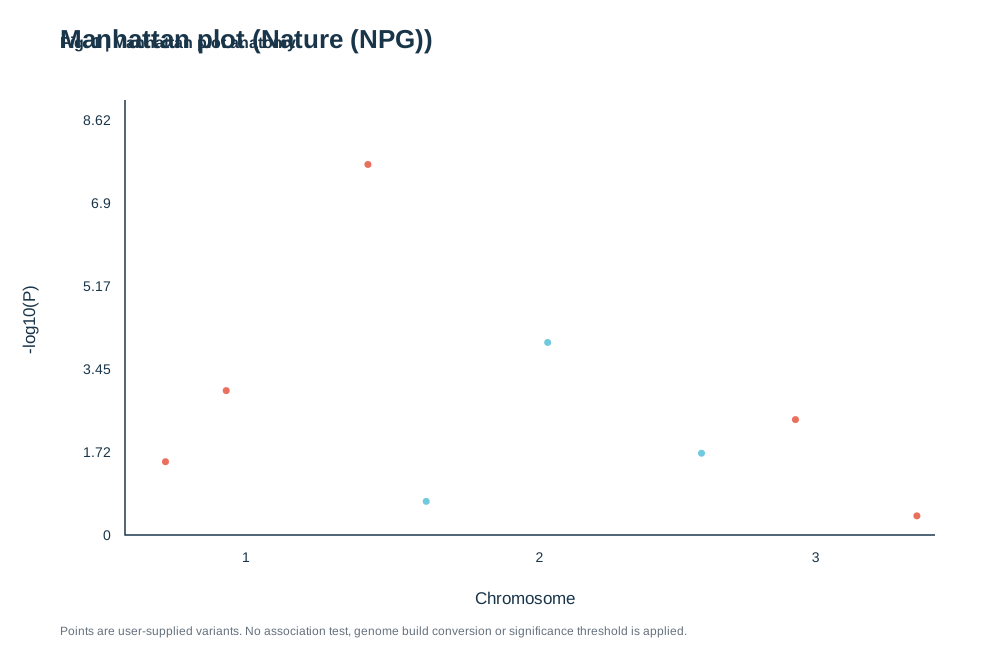
Supply chromosome, position and an existing P value for each variant. P must be greater than zero and at most one. The tool plots -log10(P); it does not run an association test or choose a significance threshold.
Supply chromosome, position and an existing P value for each variant. P must be greater than zero and at most one. The tool plots -log10(P); it does not run an association test or choose a significance threshold.
)%22%3E%3Crect%20width%3D%22100%25%22%20height%3D%22100%25%22%20fill%3D%22white%22%2F%3E%3Cstyle%3Etext%7Bfont-family%3AArial%2C%20Helvetica%2C%20sans-serif%3Bfill%3A%2319354a%7D.tick%7Bfont-size%3A14px%7D.label%7Bfont-size%3A17px%7D.small%7Bfont-size%3A12px%3Bfill%3A%2365717d%7D%3C%2Fstyle%3E%3Ctext%20x%3D%2260%22%20y%3D%2248%22%20font-size%3D%2226%22%20font-weight%3D%22700%22%3EManhattan%20plot%20(Nature%20(NPG))%3C%2Ftext%3E%3Cpath%20d%3D%22M125%20100V535H935%22%20fill%3D%22none%22%20stroke%3D%22%2319354a%22%20stroke-width%3D%221.5%22%2F%3E%3Ctext%20class%3D%22tick%22%20x%3D%22111%22%20y%3D%22540%22%20text-anchor%3D%22end%22%3E0%3C%2Ftext%3E%3Ctext%20class%3D%22tick%22%20x%3D%22111%22%20y%3D%22457%22%20text-anchor%3D%22end%22%3E1.72%3C%2Ftext%3E%3Ctext%20class%3D%22tick%22%20x%3D%22111%22%20y%3D%22374%22%20text-anchor%3D%22end%22%3E3.45%3C%2Ftext%3E%3Ctext%20class%3D%22tick%22%20x%3D%22111%22%20y%3D%22291%22%20text-anchor%3D%22end%22%3E5.17%3C%2Ftext%3E%3Ctext%20class%3D%22tick%22%20x%3D%22111%22%20y%3D%22208%22%20text-anchor%3D%22end%22%3E6.9%3C%2Ftext%3E%3Ctext%20class%3D%22tick%22%20x%3D%22111%22%20y%3D%22125%22%20text-anchor%3D%22end%22%3E8.62%3C%2Ftext%3E%3Ctext%20class%3D%22label%22%20x%3D%22525%22%20y%3D%22604%22%20text-anchor%3D%22middle%22%3EChromosome%3C%2Ftext%3E%3Ctext%20class%3D%22label%22%20transform%3D%22translate(35%20320)%20rotate(-90)%22%20text-anchor%3D%22middle%22%3E-log10(P-value)%3C%2Ftext%3E%3Cpath%20d%3D%22M125%20472.38408144479206H935%22%20stroke%3D%22%23ef4444%22%20stroke-dasharray%3D%224%204%22%20stroke-width%3D%221.2%22%2F%3E%3Ctext%20class%3D%22small%22%20x%3D%22930%22%20y%3D%22467.38408144479206%22%20text-anchor%3D%22end%22%20fill%3D%22%23ef4444%22%20font-weight%3D%22600%22%3EP%20%E2%89%A4%200.05%3C%2Ftext%3E%3Ctext%20class%3D%22tick%22%20x%3D%22246.4574898785425%22%20y%3D%22562%22%20text-anchor%3D%22middle%22%3E1%3C%2Ftext%3E%3Ccircle%20cx%3D%22165.48582995951418%22%20cy%3D%22461.7069538736763%22%20r%3D%224.5%22%20fill%3D%22%23ef4444%22%20fill-opacity%3D%220.95%22%2F%3E%3Ccircle%20cx%3D%22226.21457489878543%22%20cy%3D%22390.6161223863593%22%20r%3D%224.5%22%20fill%3D%22%23ef4444%22%20fill-opacity%3D%220.95%22%2F%3E%3Ccircle%20cx%3D%22367.914979757085%22%20cy%3D%22164.46428571428572%22%20r%3D%224.5%22%20fill%3D%22%23ef4444%22%20fill-opacity%3D%220.95%22%2F%3E%3Ctext%20class%3D%22tick%22%20x%3D%22539.5748987854251%22%20y%3D%22562%22%20text-anchor%3D%22middle%22%3E2%3C%2Ftext%3E%3Ccircle%20cx%3D%22426.21457489878543%22%20cy%3D%22501.3600001461141%22%20r%3D%223.5%22%20fill%3D%22%234DBBD5%22%20fill-opacity%3D%220.8%22%2F%3E%3Ccircle%20cx%3D%22547.6720647773279%22%20cy%3D%22342.48816318181235%22%20r%3D%224.5%22%20fill%3D%22%23ef4444%22%20fill-opacity%3D%220.95%22%2F%3E%3Ccircle%20cx%3D%22701.5182186234819%22%20cy%3D%22453.2320409415672%22%20r%3D%224.5%22%20fill%3D%22%23ef4444%22%20fill-opacity%3D%220.95%22%2F%3E%3Ctext%20class%3D%22tick%22%20x%3D%22815.6882591093117%22%20y%3D%22562%22%20text-anchor%3D%22middle%22%3E3%3C%2Ftext%3E%3Ccircle%20cx%3D%22795.4453441295547%22%20cy%3D%22419.5920410876813%22%20r%3D%224.5%22%20fill%3D%22%23ef4444%22%20fill-opacity%3D%220.95%22%2F%3E%3Ccircle%20cx%3D%22916.9028340080971%22%20cy%3D%22515.8479594967752%22%20r%3D%223.5%22%20fill%3D%22%23E64B35%22%20fill-opacity%3D%220.8%22%2F%3E%3Ctext%20x%3D%2260%22%20y%3D%22635%22%20class%3D%22small%22%3EGenome-wide%20significance%20threshold%3A%20P%20%26lt%3B%3D%200.05.%20Significant%20variants%20highlighted.%3C%2Ftext%3E%3C%2Fsvg%3E)
1. What is Manhattan plot anatomy?
Scientific definition and academic background
A Manhattan Plot is the quintessential visualization for Genome-Wide Association Studies (GWAS). It plots millions of single-nucleotide polymorphisms (SNPs) across physical chromosomal coordinates along the x-axis, with association statistical significance (-log10 P-value) on the y-axis, resembling a skyscraper skyline.
Look for peaks that cross a stated threshold, then inspect the locus and analysis details before drawing conclusions.
2. Key Visual Anatomy & Elements
Deconstruction of axes, visual geometries, and annotations
X-Axis (Chromosomes 1-22)
Linear arrangement across chromosomes, visually banded by alternating hues.
Y-Axis (-log10 P-value)
Elevated values signify robust phenotypic association.
Genome-Wide Significance Line
Stringent Bonferroni-corrected threshold (-log10 P = 7.3). Towers crossing this line represent verified risk loci.
Suggestive Significance Line
Identifies suggestive signals (-log10 P = 5.0) worthy of replication cohorts.
Alternating Chromosome Colors
Contrasting bands prevent boundary confusion between contiguous chromosomes.
3. Required Data Schema & Formatting
Column definitions, value constraints, and data specifications
| Column | Type | Example | Role & Meaning | Required |
|---|---|---|---|---|
| Chromosome | Integer/String | 1 | Chromosome identifier (1-22, X, Y) | Required |
| Position | Integer | 1543200 | Physical base pair position along chromosome | Required |
| P | Float | 2.4e-9 | Association P-value (raw, between 0 and 1) | Required |
Data Note: Requires Chromosome, Position, and P. Engine automatically transforms P into -log10(P).
4. Real Publication Sample Dataset
Copy sample data or load directly into the workspace above
Chromosome,Position,P
1,1200000,0.045
1,2500000,0.0003
1,6800000,0.00000002
2,450000,0.12
2,1850000,0.00008
3,950000,0.032
3,2400000,0.00000001
4,120000,0.45
5,890000,0.002
5. Scientific Insights & Publication Legend
Hypothesis addressed and a ready-to-use Nature/Cell figure legend template
Core Scientific Question:
Across millions of interrogated genomic variants, which chromosomal loci breach genome-wide significance thresholds for disease susceptibility?
Interpretation Guide:
Towering clusters reflecting strong linkage disequilibrium indicate bonafide risk loci; single isolated spikes warrant quality-control resequencing.
Standard Journal Figure Legend Template:
6. Peer Review Solutions & Pitfall Prevention
Overcoming reviewer critiques and eliminating common desk-rejection traps
Reviewer asks: "Did your loci survive rigorous genome-wide multiple hypothesis correction?"
Visual demonstration against the standard 5e-8 red line proves bonafide significance.
Reviewer asks: "Could your signals stem from population stratification artifacts?"
Demonstrates baseline signals settling uniformly along the baseline without systemic inflation.
7. Reviewer Checklist & Journal Formatting Specs
Four indispensable pre-submission quality checks to ensure seamless editorial pass
Column Width
Nature double column (183 mm) landscape layout
Typography
Chromosome labels: 7 pt Arial; cutoff annotations: 7.5 pt
Palettes
Alternating Deep Navy (#0f172a) and Sky Blue (#0284c7); Red threshold (#dc2626)
Resolution
Lossless vector SVG export
Genetics statistics note
A Manhattan plot does not show effect size or causality by itself. Report the tested variant set, model, correction threshold, and relevant quality controls.