GraphAbs
Create: Forest plot anatomy
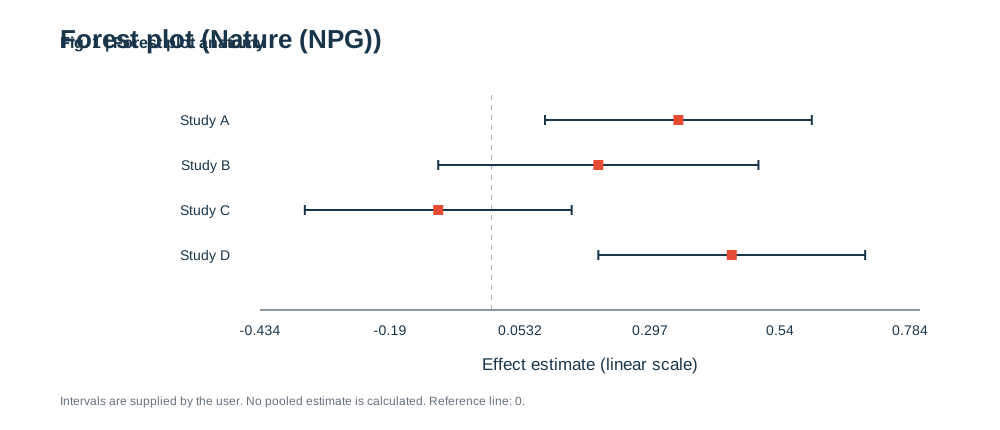
Enter study labels, effect estimates and lower/upper interval limits. The tool plots supplied intervals on a linear scale with a zero reference; it does not calculate a pooled estimate.
)%22%3E%3Crect%20width%3D%22100%25%22%20height%3D%22100%25%22%20fill%3D%22white%22%2F%3E%3Cstyle%3Etext%7Bfont-family%3AArial%2C%20Helvetica%2C%20sans-serif%3Bfill%3A%2319354a%7D.tick%7Bfont-size%3A14px%7D.label%7Bfont-size%3A17px%7D.small%7Bfont-size%3A12px%3Bfill%3A%2365717d%7D%3C%2Fstyle%3E%3Ctext%20x%3D%2260%22%20y%3D%2248%22%20font-size%3D%2226%22%20font-weight%3D%22700%22%3EForest%20plot%20(Nature%20(NPG))%3C%2Ftext%3E%3Cpath%20d%3D%22M491.60919540229884%2095V310%22%20stroke%3D%22%23a3acb6%22%20stroke-dasharray%3D%225%205%22%2F%3E%3Ctext%20class%3D%22tick%22%20x%3D%22230%22%20y%3D%22125%22%20text-anchor%3D%22end%22%3EStudy%20A%3C%2Ftext%3E%3Cpath%20d%3D%22M544.9753694581281%20120H811.8062397372742M544.9753694581281%20115V125M811.8062397372742%20115V125%22%20stroke%3D%22%2319354a%22%20stroke-width%3D%222%22%2F%3E%3Crect%20x%3D%22673.3908045977012%22%20y%3D%22115%22%20width%3D%2210%22%20height%3D%2210%22%20fill%3D%22%23E64B35%22%2F%3E%3Ctext%20class%3D%22tick%22%20x%3D%22230%22%20y%3D%22170%22%20text-anchor%3D%22end%22%3EStudy%20B%3C%2Ftext%3E%3Cpath%20d%3D%22M438.2430213464696%20165H758.4400656814449M438.2430213464696%20160V170M758.4400656814449%20160V170%22%20stroke%3D%22%2319354a%22%20stroke-width%3D%222%22%2F%3E%3Crect%20x%3D%22593.3415435139573%22%20y%3D%22160%22%20width%3D%2210%22%20height%3D%2210%22%20fill%3D%22%23E64B35%22%2F%3E%3Ctext%20class%3D%22tick%22%20x%3D%22230%22%20y%3D%22215%22%20text-anchor%3D%22end%22%3EStudy%20C%3C%2Ftext%3E%3Cpath%20d%3D%22M304.8275862068965%20210H571.6584564860427M304.8275862068965%20205V215M571.6584564860427%20205V215%22%20stroke%3D%22%2319354a%22%20stroke-width%3D%222%22%2F%3E%3Crect%20x%3D%22433.2430213464696%22%20y%3D%22205%22%20width%3D%2210%22%20height%3D%2210%22%20fill%3D%22%23E64B35%22%2F%3E%3Ctext%20class%3D%22tick%22%20x%3D%22230%22%20y%3D%22260%22%20text-anchor%3D%22end%22%3EStudy%20D%3C%2Ftext%3E%3Cpath%20d%3D%22M598.3415435139573%20255H865.1724137931035M598.3415435139573%20250V260M865.1724137931035%20250V260%22%20stroke%3D%22%2319354a%22%20stroke-width%3D%222%22%2F%3E%3Crect%20x%3D%22726.7569786535303%22%20y%3D%22250%22%20width%3D%2210%22%20height%3D%2210%22%20fill%3D%22%23E64B35%22%2F%3E%3Cpath%20d%3D%22M260%20310H920%22%20stroke%3D%22%2319354a%22%2F%3E%3Ctext%20class%3D%22tick%22%20x%3D%22260%22%20y%3D%22335%22%20text-anchor%3D%22middle%22%3E-0.434%3C%2Ftext%3E%3Ctext%20class%3D%22tick%22%20x%3D%22390%22%20y%3D%22335%22%20text-anchor%3D%22middle%22%3E-0.19%3C%2Ftext%3E%3Ctext%20class%3D%22tick%22%20x%3D%22520%22%20y%3D%22335%22%20text-anchor%3D%22middle%22%3E0.0532%3C%2Ftext%3E%3Ctext%20class%3D%22tick%22%20x%3D%22650%22%20y%3D%22335%22%20text-anchor%3D%22middle%22%3E0.297%3C%2Ftext%3E%3Ctext%20class%3D%22tick%22%20x%3D%22780%22%20y%3D%22335%22%20text-anchor%3D%22middle%22%3E0.54%3C%2Ftext%3E%3Ctext%20class%3D%22tick%22%20x%3D%22910%22%20y%3D%22335%22%20text-anchor%3D%22middle%22%3E0.784%3C%2Ftext%3E%3Ctext%20class%3D%22label%22%20x%3D%22590%22%20y%3D%22370%22%20text-anchor%3D%22middle%22%3EEffect%20estimate%20(linear%20scale)%3C%2Ftext%3E%3Ctext%20x%3D%2260%22%20y%3D%22405%22%20class%3D%22small%22%3EIntervals%20are%20supplied%20by%20the%20user.%20No%20pooled%20estimate%20is%20calculated.%20Reference%20line%3A%200.%3C%2Ftext%3E%3C%2Fsvg%3E)
1. What is Forest plot anatomy?
Scientific definition and academic background
A Forest Plot is the gold standard graphical representation of a meta-analysis in evidence-based medicine and clinical trials. It displays individual effect estimates (Odds Ratio, Relative Risk, Hazard Ratio) with 95% confidence intervals from multiple independent cohorts alongside a pooled diamond effect estimate.
Read each row as an estimate plus an uncertainty interval, then compare it with the reference line.
2. Key Visual Anatomy & Elements
Deconstruction of axes, visual geometries, and annotations
Study Cohort Column
Lists individual trials or studies included in the meta-analysis.
Effect Estimate Square
The square represents the effect size, with area proportional to the statistical weight.
Horizontal 95% CI Line
Whiskers span the lower and upper limits of the 95% confidence interval.
Vertical Null Reference Line
Value of 1.0 (for ratio metrics) or 0.0 (for additive differences); crossing indicates no significance.
Pooled Diamond
The bottom diamond encapsulates the overall pooled effect and its composite confidence interval.
3. Required Data Schema & Formatting
Column definitions, value constraints, and data specifications
| Column | Type | Example | Role & Meaning | Required |
|---|---|---|---|---|
| Study | String | KEYNOTE-024 | Clinical trial name or study label | Required |
| Effect | Float | 0.63 | Point estimate (OR, RR, or HR) | Required |
| Lower | Float | 0.47 | Lower 95% confidence interval bound | Required |
| Upper | Float | 0.84 | Upper 95% confidence interval bound | Required |
| Weight | Float | 24.5 | Percentage weight (optional) | Optional |
Data Note: Ensure consistent metric scale. Upper bound must exceed point estimate, which in turn must exceed lower bound.
4. Real Publication Sample Dataset
Copy sample data or load directly into the workspace above
Study,Effect,Lower,Upper
KEYNOTE-024,0.63,0.47,0.84
CheckMate-026,0.82,0.61,1.10
IMpower150,0.78,0.64,0.95
OAK Trial,0.73,0.62,0.87
POPLAR Trial,0.69,0.52,0.92
5. Scientific Insights & Publication Legend
Hypothesis addressed and a ready-to-use Nature/Cell figure legend template
Core Scientific Question:
Across multicenter clinical trials, does the intervention deliver statistically significant superior outcomes over standard of care?
Interpretation Guide:
If the pooled diamond falls entirely to the left of the null line without touching 1.0, the treatment yields statistically significant risk reduction.
Standard Journal Figure Legend Template:
6. Peer Review Solutions & Pitfall Prevention
Overcoming reviewer critiques and eliminating common desk-rejection traps
Reviewer asks: "Individual study results appear conflicting; how is the therapy validated?"
Synthesizes all confidence intervals into a rigorous weighted pooled diamond.
Reviewer asks: "Have you formally tested for between-study heterogeneity?"
Pairs the visual forest plot with I² statistics and Cochran Q P-values.
7. Reviewer Checklist & Journal Formatting Specs
Four indispensable pre-submission quality checks to ensure seamless editorial pass
Column Width
Lancet / Nature full width (183 mm) or 120 mm layout
Typography
Study labels: 8 pt Arial; ticks and annotations: 7 pt
Palettes
Navy (#1e3a8a) for primary cohort points; Crimson (#991b1b) for pooled diamond
Resolution
Lossless vector SVG or 600 DPI TIFF
Statistical note
Use verified estimates, interval limits and labels. This example is rendered by the tool from synthetic values. The tool displays supplied intervals; it does not estimate study weights or a pooled effect, and does not use a logarithmic ratio scale.