GraphAbs
Create: Illustrative density curve
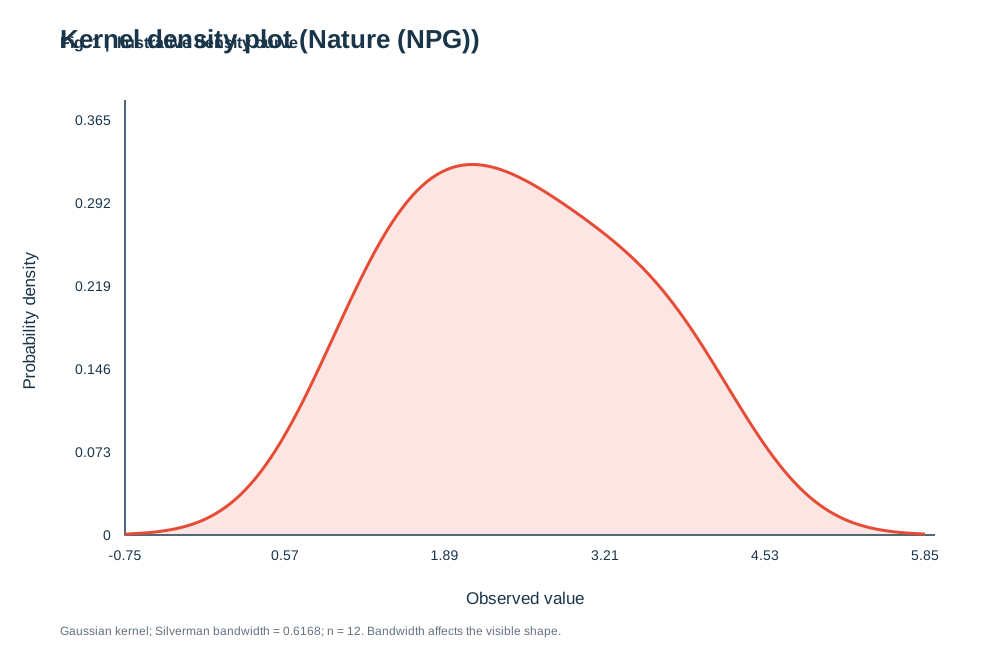
Enter at least three observations. A Gaussian kernel density estimate uses Silverman bandwidth; the chosen bandwidth and sample size appear in the output.
)%22%3E%3Crect%20width%3D%22100%25%22%20height%3D%22100%25%22%20fill%3D%22white%22%2F%3E%3Cstyle%3Etext%7Bfont-family%3AArial%2C%20Helvetica%2C%20sans-serif%3Bfill%3A%2319354a%7D.tick%7Bfont-size%3A14px%7D.label%7Bfont-size%3A17px%7D.small%7Bfont-size%3A12px%3Bfill%3A%2365717d%7D%3C%2Fstyle%3E%3Ctext%20x%3D%2260%22%20y%3D%2248%22%20font-size%3D%2226%22%20font-weight%3D%22700%22%3EKernel%20density%20plot%20(Nature%20(NPG))%3C%2Ftext%3E%3Cpath%20d%3D%22M125%20100V535H935%22%20fill%3D%22none%22%20stroke%3D%22%2319354a%22%20stroke-width%3D%221.5%22%2F%3E%3Ctext%20class%3D%22tick%22%20x%3D%22125%22%20y%3D%22560%22%20text-anchor%3D%22middle%22%3E-0.75%3C%2Ftext%3E%3Ctext%20class%3D%22tick%22%20x%3D%22111%22%20y%3D%22540%22%20text-anchor%3D%22end%22%3E0%3C%2Ftext%3E%3Ctext%20class%3D%22tick%22%20x%3D%22285%22%20y%3D%22560%22%20text-anchor%3D%22middle%22%3E0.57%3C%2Ftext%3E%3Ctext%20class%3D%22tick%22%20x%3D%22111%22%20y%3D%22457%22%20text-anchor%3D%22end%22%3E0.073%3C%2Ftext%3E%3Ctext%20class%3D%22tick%22%20x%3D%22445%22%20y%3D%22560%22%20text-anchor%3D%22middle%22%3E1.89%3C%2Ftext%3E%3Ctext%20class%3D%22tick%22%20x%3D%22111%22%20y%3D%22374%22%20text-anchor%3D%22end%22%3E0.146%3C%2Ftext%3E%3Ctext%20class%3D%22tick%22%20x%3D%22605%22%20y%3D%22560%22%20text-anchor%3D%22middle%22%3E3.21%3C%2Ftext%3E%3Ctext%20class%3D%22tick%22%20x%3D%22111%22%20y%3D%22291%22%20text-anchor%3D%22end%22%3E0.219%3C%2Ftext%3E%3Ctext%20class%3D%22tick%22%20x%3D%22765%22%20y%3D%22560%22%20text-anchor%3D%22middle%22%3E4.53%3C%2Ftext%3E%3Ctext%20class%3D%22tick%22%20x%3D%22111%22%20y%3D%22208%22%20text-anchor%3D%22end%22%3E0.292%3C%2Ftext%3E%3Ctext%20class%3D%22tick%22%20x%3D%22925%22%20y%3D%22560%22%20text-anchor%3D%22middle%22%3E5.85%3C%2Ftext%3E%3Ctext%20class%3D%22tick%22%20x%3D%22111%22%20y%3D%22125%22%20text-anchor%3D%22end%22%3E0.365%3C%2Ftext%3E%3Ctext%20class%3D%22label%22%20x%3D%22525%22%20y%3D%22604%22%20text-anchor%3D%22middle%22%3EObserved%20value%3C%2Ftext%3E%3Ctext%20class%3D%22label%22%20transform%3D%22translate(35%20320)%20rotate(-90)%22%20text-anchor%3D%22middle%22%3EProbability%20density%3C%2Ftext%3E%3Cpolyline%20points%3D%22125%2C534.0854343659878%20130.0314465408805%2C533.8718582071618%20135.062893081761%2C533.6142187419189%20140.0943396226415%2C533.3048319719462%20145.125786163522%2C532.9349862255038%20150.15723270440253%2C532.4948685639062%20155.18867924528303%2C531.973498721986%20160.22012578616352%2C531.3586736951761%20165.25157232704402%2C530.6369263684471%20170.2830188679245%2C529.7935018015605%20175.31446540880503%2C528.8123549204875%20180.34591194968556%2C527.6761733958155%20185.37735849056605%2C526.366429395851%20190.40880503144652%2C524.8634636672068%20195.44025157232704%2C523.1466050044294%20200.47169811320754%2C521.1943276125727%20205.50314465408803%2C518.9844481380809%20210.53459119496853%2C516.4943632461689%20215.56603773584905%2C513.7013275669747%20220.59748427672957%2C510.58277063633506%20225.62893081761007%2C507.1166501469302%20230.66037735849056%2C503.28183743716227%20235.6918238993711%2C499.0585297218671%20240.72327044025155%2C494.4286821611751%20245.75471698113208%2C489.37645152735786%20250.78616352201257%2C483.8886420235864%20255.81761006289304%2C477.9551427934846%20260.8490566037736%2C471.5693458947837%20265.8805031446541%2C464.72853304819506%20270.9119496855346%2C457.43421936006007%20275.9433962264151%2C449.692442490006%20280.9748427672956%2C441.5139864150596%20286.00628930817606%2C432.91453003620495%20291.0377358490566%2C423.91471237187386%20296.06918238993705%2C414.5401079568927%20301.1006289308176%2C404.821108268546%20306.1320754716981%2C394.79270747004324%20311.1635220125786%2C384.4941934169122%20316.19496855345915%2C373.9687476222896%20321.2264150943396%2C363.2629606223675%20326.25786163522014%2C352.42627181835655%20331.2893081761007%2C341.51034529119806%20336.3207547169811%2C330.5683951898169%20341.3522012578616%2C319.6544759927941%20346.3836477987422%2C308.82275416120757%20351.41509433962267%2C298.1267783798897%20356.4465408805031%2C287.61876569002527%20361.47798742138366%2C277.34892033636004%20366.50943396226415%2C267.3648011007489%20371.54088050314465%2C257.7107513085333%20376.57232704402514%2C248.42740363665854%20381.6037735849057%2C239.55126940443955%20386.6352201257861%2C231.1144192880676%20391.66666666666663%2C223.14425947904186%20396.6981132075472%2C215.6634043222603%20401.7295597484277%2C208.68964354029805%20406.7610062893082%2C202.23599939094402%20411.79245283018867%2C196.31086662015554%20416.82389937106916%2C190.9182259527165%20421.8553459119497%2C186.05792018027216%20426.8867924528302%2C181.72598071207273%20431.91823899371064%2C177.91499177588292%20436.9496855345912%2C174.6144792997352%20441.9811320754717%2C171.8113118513752%20447.0125786163522%2C169.4901018220241%20452.04402515723274%2C167.63359625669688%20457.0754716981132%2C166.22304828191233%20462.1069182389937%2C165.2385618793233%20467.13836477987417%2C164.6594047098588%20472.16981132075466%2C164.46428571428578%20477.2012578616352%2C164.63159621126044%20482.2327044025157%2C165.1396150971891%20487.2641509433962%2C165.96668044674328%20492.29559748427675%2C167.09133125359716%20497.32704402515725%2C168.49242418653563%20502.35849056603774%2C170.149231030331%20507.3899371069183%2C172.041522913236%20512.4213836477987%2C174.14964748893112%20517.4528301886792%2C176.45460495074792%20522.4842767295597%2C178.93812813454826%20527.5157232704403%2C181.58277105093623%20532.5471698113206%2C184.3720090254302%20537.5786163522014%2C187.2903522735533%20542.6100628930817%2C190.32347325974547%20547.6415094339623%2C193.45834665212158%20552.6729559748428%2C196.68339915893552%20557.7044025157232%2C199.98866508636087%20562.7358490566037%2C203.36594215749733%20567.7672955974843%2C206.8089410411988%20572.7987421383648%2C210.31342121134367%20577.8301886792453%2C213.87730523865918%20582.8616352201258%2C217.5007634436305%20587.8930817610062%2C221.18626103367177%20592.9245283018868%2C224.93856042039255%20597.9559748427673%2C228.76467235884974%20602.9874213836478%2C232.67375085055937%20608.0188679245283%2C236.6769283712249%20613.0503144654087%2C240.78708987357618%20618.0817610062893%2C245.01858611301373%20623.1132075471698%2C249.38688907480497%20628.1446540880503%2C253.9081945629065%20633.176100628931%2C258.5989792521474%20638.2075471698114%2C263.47552161441916%20643.2389937106918%2C268.55339801333974%20648.2704402515722%2C273.84696683289894%20653.3018867924529%2C279.3688546850335%20658.3333333333333%2C285.1294594628126%20663.3647798742138%2C291.1364852202571%20668.3962264150944%2C297.39452353647636%20673.4276729559748%2C303.90469515222765%20678.4591194968554%2C310.66436426564553%20683.4905660377358%2C317.66693597853657%20688.5220125786165%2C324.90174505548566%20693.5534591194968%2C332.3540414756799%20698.5849056603773%2C340.00507531963024%20703.6163522012579%2C347.83228045082404%20708.6477987421383%2C355.80955334492086%20713.6792452830188%2C363.9076204083317%20718.7106918238994%2C372.09448433287105%20723.7421383647799%2C380.33593756407663%20728.7735849056603%2C388.5961289143222%20733.805031446541%2C396.8381678061681%20738.8364779874213%2C405.02474964263945%20743.8679245283017%2C413.1187854008179%20748.8993710691824%2C421.08401873904177%20753.9308176100628%2C428.88561467626505%20758.9622641509434%2C436.49070520059064%20763.9937106918239%2C443.868878926993%20769.0251572327044%2C450.9926040682788%20774.0566037735848%2C457.8375764115101%20779.0880503144655%2C464.3829865992478%20784.1194968553459%2C470.61170369291904%20789.1509433962264%2C476.51037463831733%20794.1823899371069%2C482.0694417617603%20799.2138364779875%2C487.28308271208385%20804.2452830188679%2C492.1490792554341%20809.2767295597482%2C496.66862297094383%20814.308176100629%2C500.84606714867766%20819.3396226415093%2C504.68863503852845%20824.3710691823898%2C508.20609504032325%20829.4025157232704%2C511.4104134784576%20834.4339622641509%2C514.3153953008735%20839.4654088050313%2C516.9363224260409%20844.496855345912%2C519.2895985855538%20849.5283018867924%2C521.3924084323836%20854.5597484276728%2C523.262397466449%20859.5911949685535%2C524.9173780300372%20864.6226415094338%2C526.3750653025423%20869.6540880503144%2C527.6528459282071%20874.6855345911949%2C528.7675806861924%20879.7169811320755%2C529.7354414951369%20884.7484276729559%2C530.5717820613299%20889.7798742138366%2C531.2910406487064%20894.811320754717%2C531.9066727794939%20899.8427672955974%2C532.4311111681319%20904.8742138364778%2C532.8757498428602%20909.9056603773582%2C533.2509492084015%20914.9371069182389%2C533.566058734403%20919.9685534591196%2C533.8294539997695%20925%2C534.0485849630179%22%20stroke%3D%22%23E64B35%22%20stroke-width%3D%223%22%20fill%3D%22%23E64B35%22%20fill-opacity%3D%220.14%22%2F%3E%3Ctext%20x%3D%2260%22%20y%3D%22635%22%20class%3D%22small%22%3EGaussian%20kernel%3B%20Silverman%20bandwidth%20%3D%200.6168%3B%20n%20%3D%2012.%20Bandwidth%20affects%20the%20visible%20shape.%3C%2Ftext%3E%3C%2Fsvg%3E)
1. What is Illustrative density curve?
Scientific definition and academic background
A kernel density plot estimates the smooth probability density curve of a continuous variable using Gaussian kernels and Silverman bandwidth—revealing modality, skew, and spread without histogram binning artifacts.
Interpret the curve as a smoothed view of distribution, with attention to scale and smoothing choices.
2. Key Visual Anatomy & Elements
Deconstruction of axes, visual geometries, and annotations
Smoothed Density Curve
Gaussian KDE curve integrating to 1, revealing peaks and skew.
Bandwidth & Sample Size
Displays the Silverman bandwidth and sample count directly in the plot.
Value & Density Axes
Clearly labeled continuous measurement axis and probability density axis.
3. Required Data Schema & Formatting
Column definitions, value constraints, and data specifications
| Column | Type | Example | Role & Meaning | Required |
|---|---|---|---|---|
| Value | Float | 1.1, 1.8, 3.4 | Continuous observations (at least 3 values) | Required |
Data Note: Provide at least three numeric values. Uses a Gaussian kernel with Silverman bandwidth.
4. Real Publication Sample Dataset
Copy sample data or load directly into the workspace above
Value
1.1
1.4
1.5
1.8
2.1
2.2
2.6
2.7
3.1
3.4
3.8
4.0
5. Scientific Insights & Publication Legend
Hypothesis addressed and a ready-to-use Nature/Cell figure legend template
Core Scientific Question:
Is the measured variable unimodal or multimodal, and how skewed is its underlying distribution?
Interpretation Guide:
A single symmetric peak suggests a homogeneous population, whereas multiple modes or heavy tails indicate biological subpopulations.
Standard Journal Figure Legend Template:
6. Peer Review Solutions & Pitfall Prevention
Overcoming reviewer critiques and eliminating common desk-rejection traps
Reviewer notes: "Histogram bin width appears arbitrary and obscures distribution shape."
Replaces binned bars with a reproducible Gaussian KDE reporting Silverman bandwidth.
7. Reviewer Checklist & Journal Formatting Specs
Four indispensable pre-submission quality checks to ensure seamless editorial pass
Column Width
Single column (89 mm)
Typography
Arial / Helvetica 7–8 pt
Palettes
Solid stroke with 15%–25% translucent fill
Resolution
Vector SVG/PDF
Statistics note
Show the scale, sample size, and smoothing method when the audience needs to compare distributions. The preview here uses synthetic values.