Deterministic Scientific Data Plots
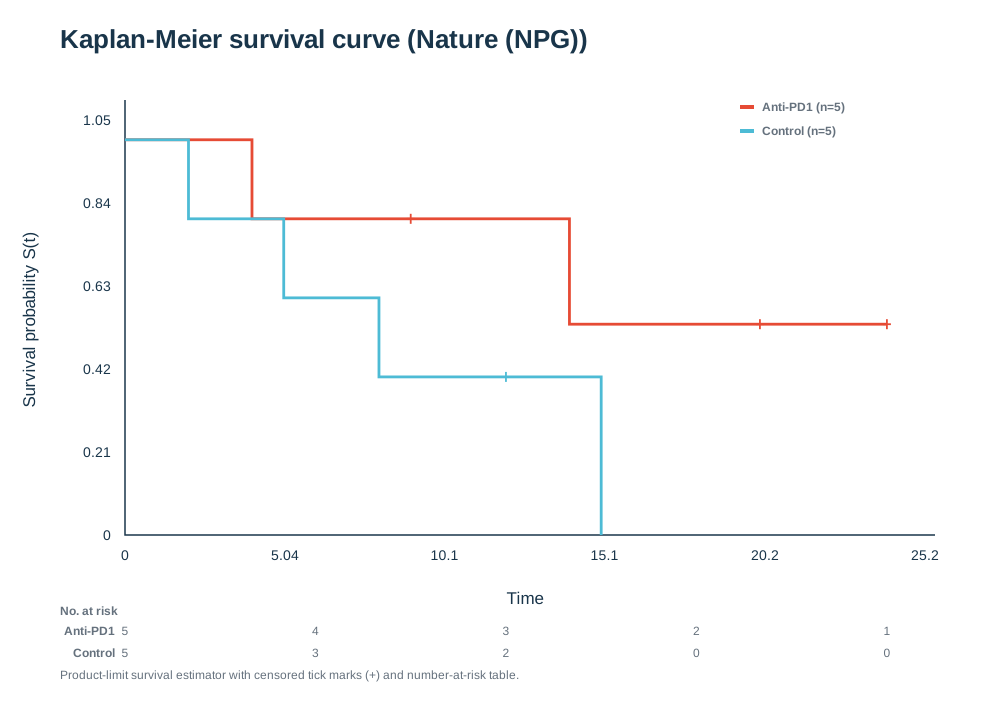
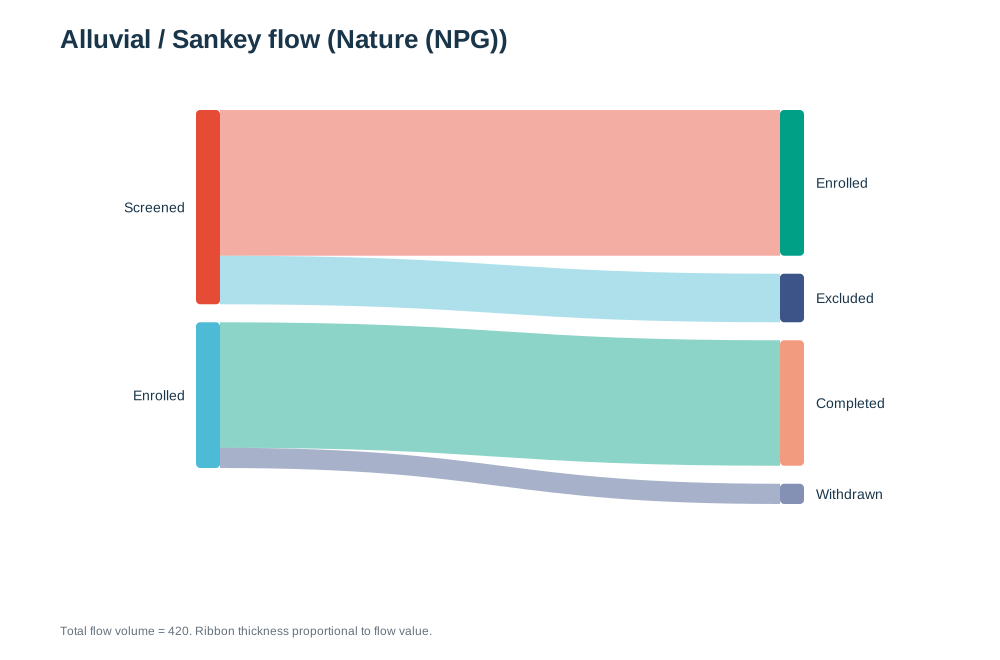
Upload CSV/Excel tables to generate 21 data plot and schematic options (Volcano, Kaplan-Meier, Manhattan, Sankey). 100% deterministic 0-credit vector rendering.
Create SVG data plots from your supplied values and assemble Nature/PLOS/JCB multi-panel figures at no credit cost. AI mechanism drafts support in-place regional refinement; credit packs never expire.
Review scientific accuracy and image labels before publication.
Engineered specifically for peer-reviewed journal submission: deterministic data charts with instant 0-credit SVG tuning, publication-standard multi-panel assembly with automated sublabeling, and interactive in-place agent refinement for biological mechanisms.
Upload CSV/Excel tables to generate 21 data plot and schematic options (Volcano, Kaplan-Meier, Manhattan, Sankey). 100% deterministic 0-credit vector rendering.
Combine individual plots, micrographs, and blot scans into a cohesive Figure 1. Formatted to Nature 89 mm single-column and 183 mm double-column standards with bold a–d sublabels.
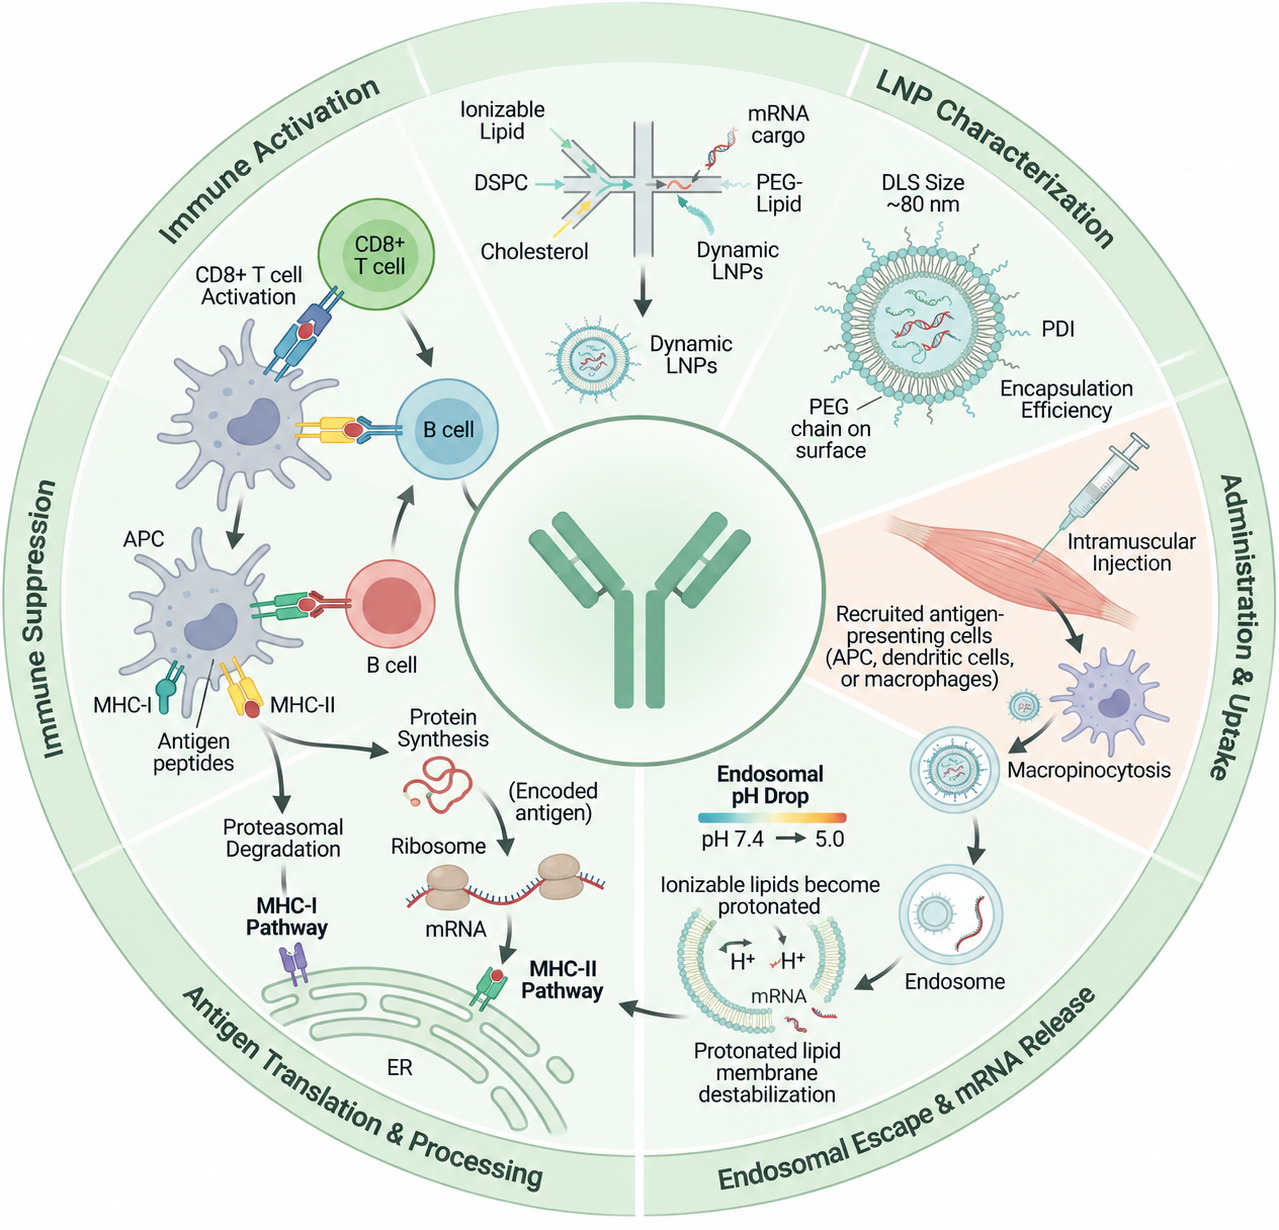
AI Illustration & RefinementTransform hypotheses, manuscript abstracts, or whiteboard sketches into publication-grade mechanism diagrams. Circle any element on the canvas for localized AI Agent redrawing.
From raw research ideas to figures meeting stringent peer-review requirements
Import CSV data tables, paste paper abstracts, upload hand-drawn sketches, or drag in existing micrographs.
Adjust statistical thresholds (P ≤ 0.01) with zero credit cost; circle specific regions for AI agent inpainting.
Fit Nature 90 mm single / 180 mm double column limits, auto-sublabel (a, b, c, d), and export SVG.
From preliminary pathway sketches and laboratory captures to published preprint PDFs and plain-text descriptions, convert any research material into publication-grade scientific figures.
Describe the structures, labels and relationships you want to explain. Edit the prompt before generating.
Describe a mitochondrion in cross-section. Label the outer membrane, inner membrane, cristae and matrix.
Strictly compliant with international journal accessibility guidelines, featuring colorblind-safe (Deuteranopia/Protanopia) contrast. Click any journal palette to switch live chart preview in real-time.
Illustrative preview with synthetic data. Palette names indicate style inspiration, not journal endorsement.
Explore peer-reviewed templates across cell biology, immunology, neuroscience, and biochemistry. Load any template as an AI Agent baseline for interactive circle-and-edit fine-tuning or swap in your own research datasets.
Purpose-built generators for RNA-seq volcano plots, Kaplan-Meier curves, PRISMA flowcharts, and 96-well layouts. 100% deterministic SVG rendering with zero credit deduction.
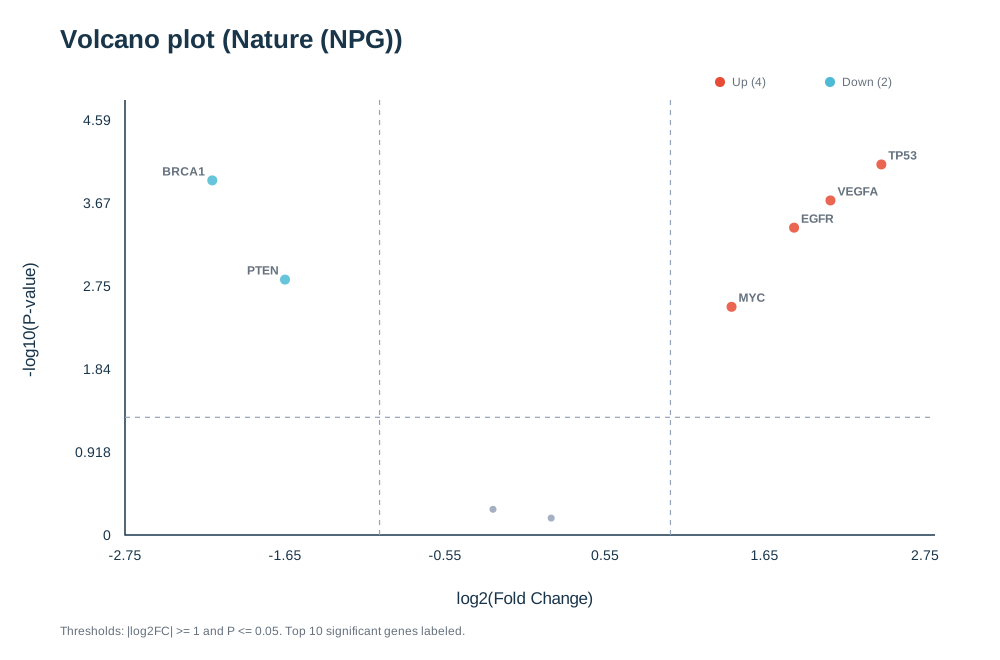
RNA-seq and proteomics differential expression with automated significance cutoffs.
Clinical survival analysis with number-at-risk table and Log-rank test.
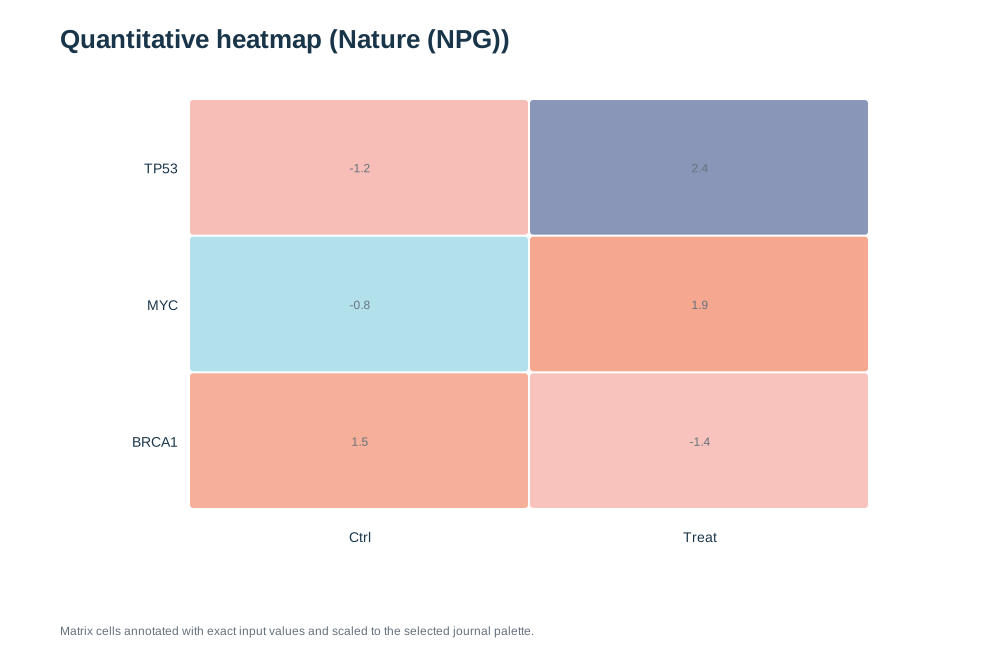
Gene expression hierarchical clustering with Z-score normalization and dendrograms.
Cell lineage differentiation, energy metabolism, and multi-component flow diagrams.
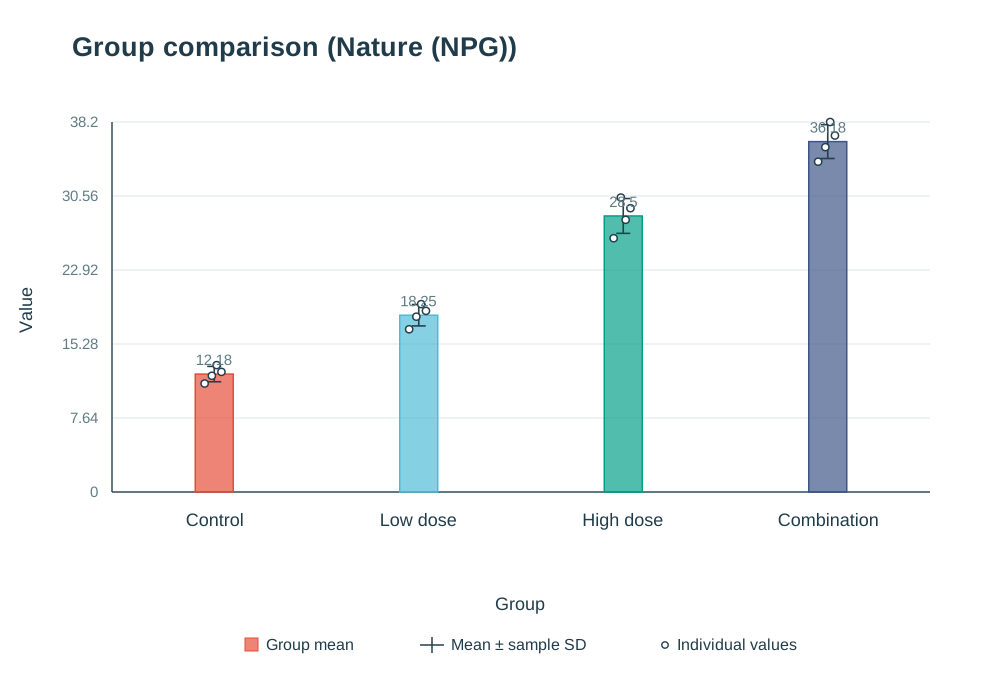
Multi-group comparison with SD/SEM error bars and significance brackets.
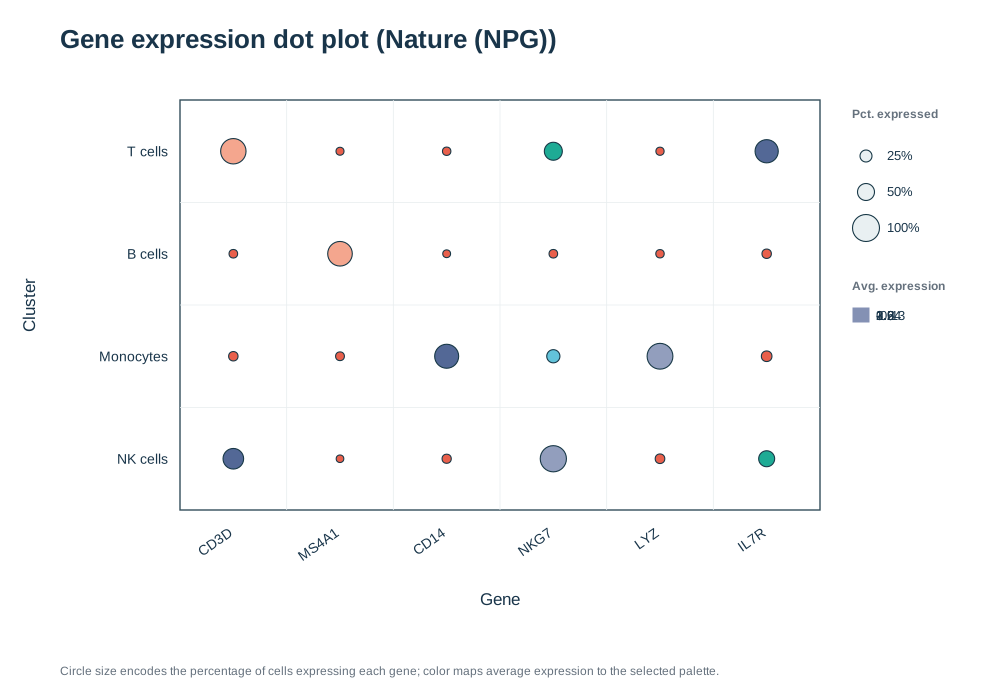
Single-cell marker gene dot plots with expression ratio size and color intensity.
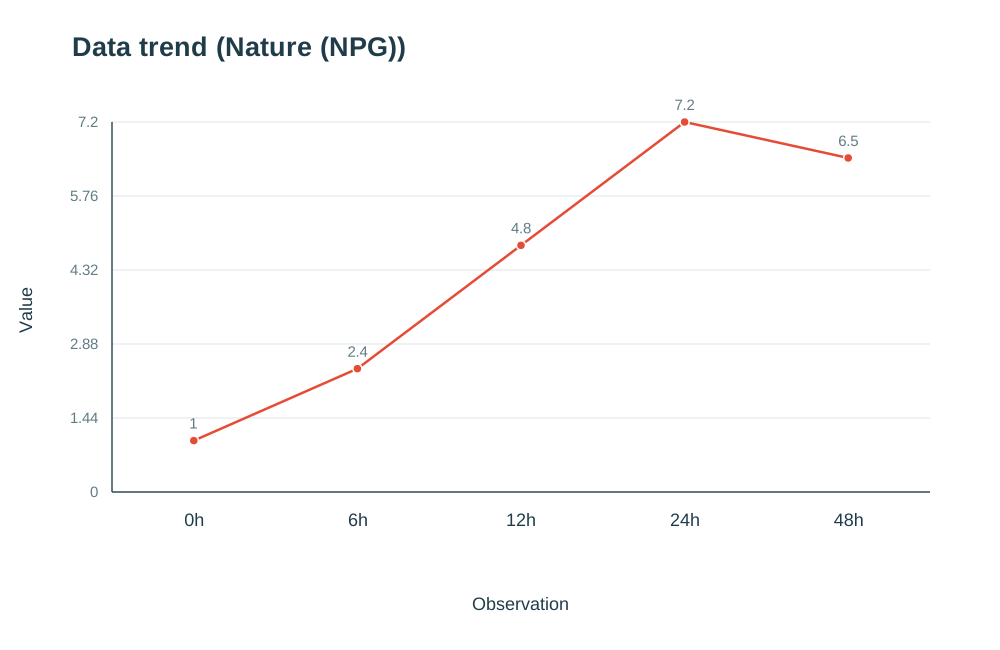
Time-series kinetics and enzyme reactions with shaded error bands.
Everything you need to know about 300+ DPI TIFF exports, Nature/Cell layout rules, zero-cost data plotting, and AI model usage.
0 credits for native SVG data plots · Nature & Cell standard compliant · 300+ DPI TIFF export