GraphAbs
Create: Two-set Venn diagram
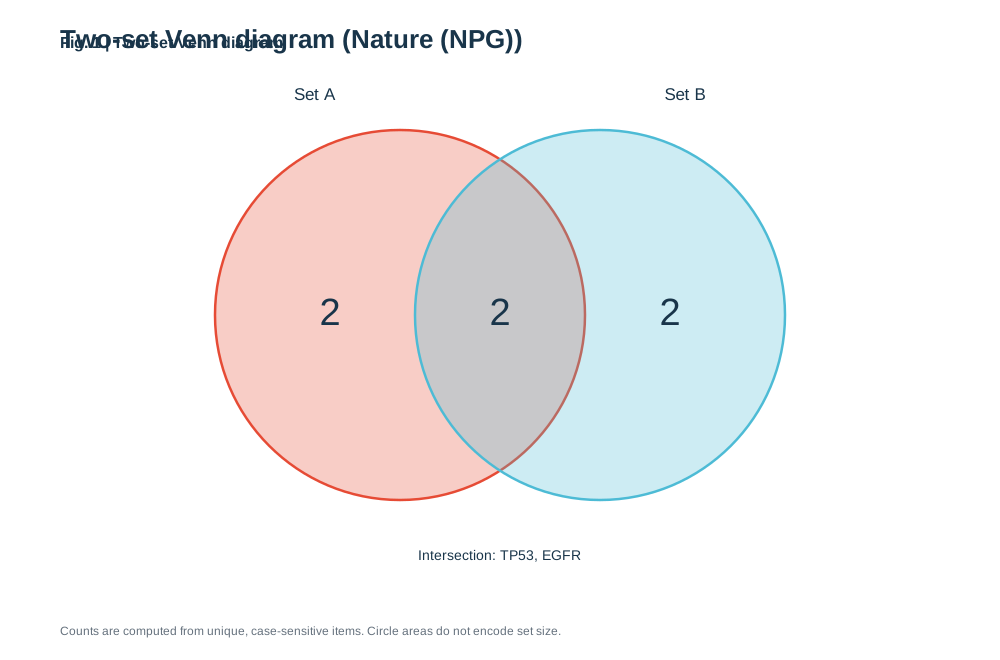
Enter two named sets, one per line. Counts use unique, case-sensitive items. The overlap count is exact; circle areas are schematic and do not encode set size.
)%22%3E%3Crect%20width%3D%22100%25%22%20height%3D%22100%25%22%20fill%3D%22white%22%2F%3E%3Cstyle%3Etext%7Bfont-family%3AArial%2C%20Helvetica%2C%20sans-serif%3Bfill%3A%2319354a%7D.tick%7Bfont-size%3A14px%7D.label%7Bfont-size%3A17px%7D.small%7Bfont-size%3A12px%3Bfill%3A%2365717d%7D%3C%2Fstyle%3E%3Ctext%20x%3D%2260%22%20y%3D%2248%22%20font-size%3D%2226%22%20font-weight%3D%22700%22%3ETwo-set%20Venn%20diagram%20(Nature%20(NPG))%3C%2Ftext%3E%3Ccircle%20cx%3D%22400%22%20cy%3D%22315%22%20r%3D%22185%22%20fill%3D%22%23E64B35%22%20fill-opacity%3D%22.28%22%20stroke%3D%22%23E64B35%22%20stroke-width%3D%222.5%22%2F%3E%3Ccircle%20cx%3D%22600%22%20cy%3D%22315%22%20r%3D%22185%22%20fill%3D%22%234DBBD5%22%20fill-opacity%3D%22.28%22%20stroke%3D%22%234DBBD5%22%20stroke-width%3D%222.5%22%2F%3E%3Ctext%20class%3D%22label%22%20x%3D%22315%22%20y%3D%22100%22%20text-anchor%3D%22middle%22%3ESet%20A%3C%2Ftext%3E%3Ctext%20class%3D%22label%22%20x%3D%22685%22%20y%3D%22100%22%20text-anchor%3D%22middle%22%3ESet%20B%3C%2Ftext%3E%3Ctext%20x%3D%22330%22%20y%3D%22325%22%20font-size%3D%2238%22%20text-anchor%3D%22middle%22%3E2%3C%2Ftext%3E%3Ctext%20x%3D%22500%22%20y%3D%22325%22%20font-size%3D%2238%22%20text-anchor%3D%22middle%22%3E2%3C%2Ftext%3E%3Ctext%20x%3D%22670%22%20y%3D%22325%22%20font-size%3D%2238%22%20text-anchor%3D%22middle%22%3E2%3C%2Ftext%3E%3Ctext%20class%3D%22tick%22%20x%3D%22500%22%20y%3D%22560%22%20text-anchor%3D%22middle%22%3EIntersection%3A%20TP53%2C%20EGFR%3C%2Ftext%3E%3Ctext%20x%3D%2260%22%20y%3D%22635%22%20class%3D%22small%22%3ECounts%20are%20computed%20from%20unique%2C%20case-sensitive%20items.%20Circle%20areas%20do%20not%20encode%20set%20size.%3C%2Ftext%3E%3C%2Fsvg%3E)
1. What is Two-set Venn diagram?
Scientific definition and academic background
A Venn diagram visualizes shared and unique items across two or more sets—commonly used in genomics, proteomics, and cohort screening to highlight overlapping candidate genes or biomarkers.
Use a Venn diagram when the question is about membership overlap and the number of sets is small.
2. Key Visual Anatomy & Elements
Deconstruction of axes, visual geometries, and annotations
Translucent Set Circles
Restrained journal colors with balanced opacity keep overlap regions legible.
Exact Overlap Counts
Computes unique, case-sensitive intersections without manual counting errors.
Set Labels & Totals
Clearly displays each cohort or gene-list name alongside its total size.
Schematic Area Note
Clarifies that circle areas are schematic while printed counts are exact.
3. Required Data Schema & Formatting
Column definitions, value constraints, and data specifications
| Column | Type | Example | Role & Meaning | Required |
|---|---|---|---|---|
| Set Name | String | RNA-seq Up | Set identifier before the colon | Required |
| Members | List | BRCA1, TP53, EGFR | Comma-separated unique items after the colon | Required |
Data Note: Enter two named sets, one per line (`Set Name: item1, item2, ...`). Counts are computed over unique, case-sensitive items.
4. Real Publication Sample Dataset
Copy sample data or load directly into the workspace above
Set A: BRCA1, TP53, EGFR, MYC
Set B: TP53, EGFR, KRAS, APC
5. Scientific Insights & Publication Legend
Hypothesis addressed and a ready-to-use Nature/Cell figure legend template
Core Scientific Question:
Which candidate genes or biomarkers are reproducibly shared across two independent cohorts or experimental screens?
Interpretation Guide:
The central overlap identifies conserved candidates prioritized for downstream validation, while outer regions highlight condition-specific hits.
Standard Journal Figure Legend Template:
6. Peer Review Solutions & Pitfall Prevention
Overcoming reviewer critiques and eliminating common desk-rejection traps
Reviewer notes: "The overlap count in the Venn diagram disagrees with Supplementary Table 2."
Computes exact unique intersections deterministically from your pasted item lists.
7. Reviewer Checklist & Journal Formatting Specs
Four indispensable pre-submission quality checks to ensure seamless editorial pass
Column Width
Single column (89 mm) fits cleanly
Typography
Arial / Helvetica 7–8 pt
Palettes
Use high-contrast colorblind-safe pairs (Nature NPG or Okabe-Ito)
Resolution
Vector SVG/PDF or 300+ DPI
Diagram note
This static figure is a conceptual layout, not an interactive set editor. For quantitative comparisons, use a chart that can encode values directly.