GraphAbs
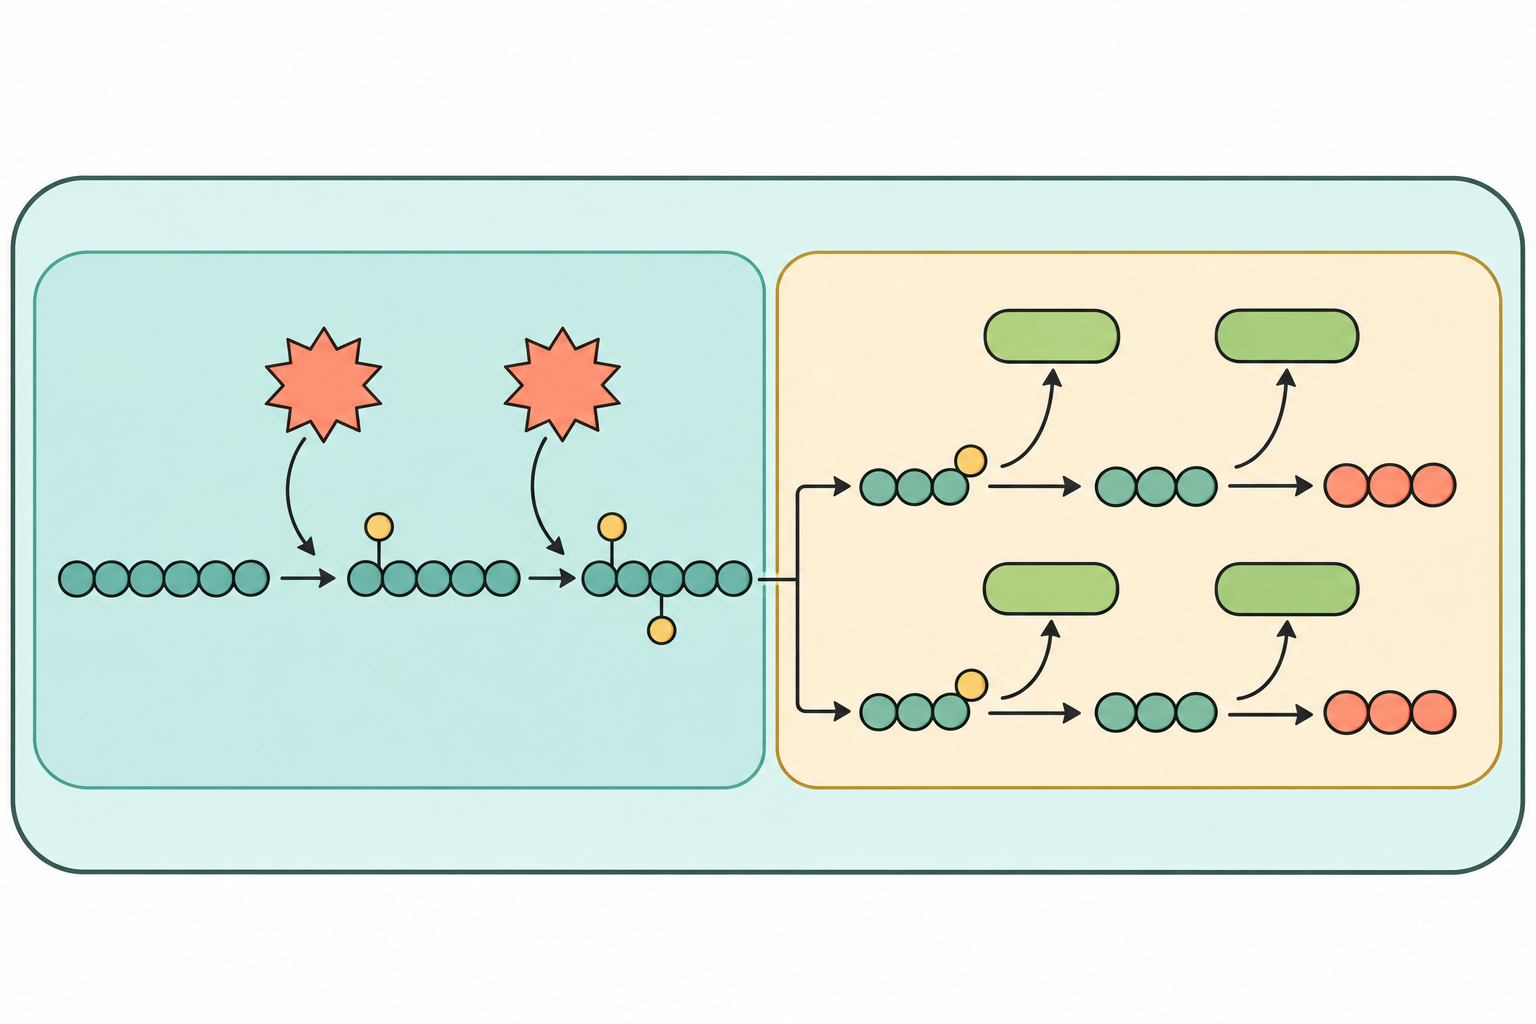
Create: Glycolysis in two phases
Edit the structures, labels and subject in the prompt, then generate an AI illustration. The example is an original vector schematic; AI output is a raster image. Review every structure and label before publication.
1. What is Glycolysis in two phases?
Scientific definition and academic background
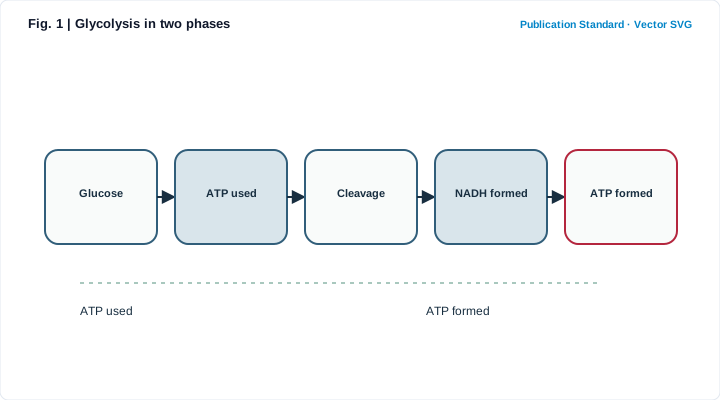
A glycolysis diagram condenses a ten-reaction pathway into a readable sequence. This overview highlights the investment and payoff phases while leaving individual intermediates for a detailed pathway map.
The pathway changes one six-carbon sugar into two three-carbon products.
2. Key Visual Anatomy & Elements
Deconstruction of axes, visual geometries, and annotations
Clear Boundaries & Hierarchy
Distinguishes outer boundaries, internal compartments, and relative spatial layout.
Directional & Process Cues
Uses consistent arrow styles to indicate flow, sequence, or regulation without ambiguity.
Standardized Callout Labels
Aligned sans-serif labels sized to remain legible at journal single-column print widths.
Restrained Journal Palette
Clean white background with 3–5 muted hues that keep focus on scientific meaning.
3. Core Structure & Labeling Checklist
Key structures, reading order, and visual cues to specify before generating
- List the exact anatomical or conceptual structures required in Glycolysis in two phases so no critical label is omitted.
- Specify a clean white background and flat editorial vector style—avoid decorative 3D glare or clutter.
- Define the reading order (e.g., outer-to-inner, left-to-right, or numbered stages) for clear comprehension.
- Verify every label spelling, arrow direction, and scientific relationship before manuscript submission.
4. Reusable Scientific Illustration Prompt
Copy or load this structured prompt into the studio and customize the labels
Glycolysis in two phases. A glycolysis diagram condenses a ten-reaction pathway into a readable sequence. This overview highlights the investment and payoff phases while leaving individual intermediates for a detailed pathway map. Include these labels: Glucose, ATP used, Cleavage, NADH formed, ATP formed, Pyruvate. White background; restrained navy, crimson and sage scientific palette. Simplified schematic, not to scale.
5. Scientific Insights & Publication Legend
Hypothesis addressed and a ready-to-use Nature/Cell figure legend template
Core Scientific Question:
How can a clear, unambiguous Glycolysis in two phases schematic communicate core structures and processes at a glance?
Interpretation Guide:
Condensing dense background text into a structured visual anchor helps reviewers grasp your model immediately and pairs cleanly with data panels in multi-panel figures.
Standard Journal Figure Legend Template:
6. Peer Review Solutions & Pitfall Prevention
Overcoming reviewer critiques and eliminating common desk-rejection traps
Reviewer notes: "The text description is dense; a clear overview schematic is needed."
Generates a structured publication draft from this template with in-place regional refinement.
Reviewer notes: "A specific label or directional arrow in the schematic needs correction."
Circle the region in the studio to revise only that area while preserving the rest of the layout.
7. Reviewer Checklist & Journal Formatting Specs
Four indispensable pre-submission quality checks to ensure seamless editorial pass
Column Width
Nature single column (89 mm) or full width (183 mm), max height 220 mm
Typography
Arial / Helvetica, 8–9 pt for headings, 7–8 pt for labels
Palettes
Restrained academic palette (Navy, Ochre, Sage), avoiding neon saturations
Resolution
300–600 DPI print resolution, or assemble with target journal widths in TIFF / SVG
Biochemistry note
Net stoichiometry is commonly summarized per glucose molecule, but enzyme regulation and metabolite concentrations require a more detailed pathway figure.